Want to create your own video?
The video created for 7th Grade Social Studies students is on the topic of checks and balances. Its intent is to give students a brief overview of the checks and balances chart that they will be using in class throughout the next unit. It could possibly serve two purposes. One could be to give students a preview of an upcoming class. They could watch at home and then be better prepared to discuss the topics and ask questions the following day in class. It could also serve the purpose of filling in students who missed this lesson in class. They could have the opportunity to watch the video at home to catch up.
The video was created using the Google Chrome application Screencastify. With this application, a user can record their screen and the audio that goes along with it. This is a great tool for teachers to use when going through a process that they would like their students to emulate. In this case it was how to fill out the checks and balances chart. It would also be a great tool for creating step by step directions for students to show them how to carry out a technical process on their own computer.
Once the application is added to the Chrome browser, the icon for Screencastify appears up in the top right section of the window next to the URL/search bar. Once the icon is clicked, the user can choose to give Screencastify permission to use the computer’s microphone. It also asks the user to choose whether or not they want just one window to be recorded or if they want their entire computer screen to be recorded. For the video mentioned above, only a window with a Google Doc open needed to be recorded.
The chart that the students would be using was opened in a Google Doc. Once the creator hits the record button, a countdown appears on the screen and the application begins to record what the user is doing on their screen and the audio picked up by the computer’s microphone. For this video, the creator filled in the chart in the Google Doc and spoke about the process, much as a teacher would do at the front of the room, minus any input from students that would have occurred in a typical in-class lesson. When the creator is ready to stop the recording, they can click the Screencastify icon at the top of the screen and hit the stop button.
The application then gives the user the choice of what they would like to do with their video. In this case, the creator chose to upload the video to YouTube. Screencastify makes the process extremely simple. The creator is able to log in to their YouTube account right there and choose the sharing settings for the video. Once the video is uploaded, anyone with the link to the video is able to view it. The video was embedded into the teacher’s website (www.hulicksocialstudies.weebly.com) under the Classroom Resources tab so that students can view it at home. There is also a link to YouTube above the video, set as the title above the embedded video, so students can access the video from YouTube as well.
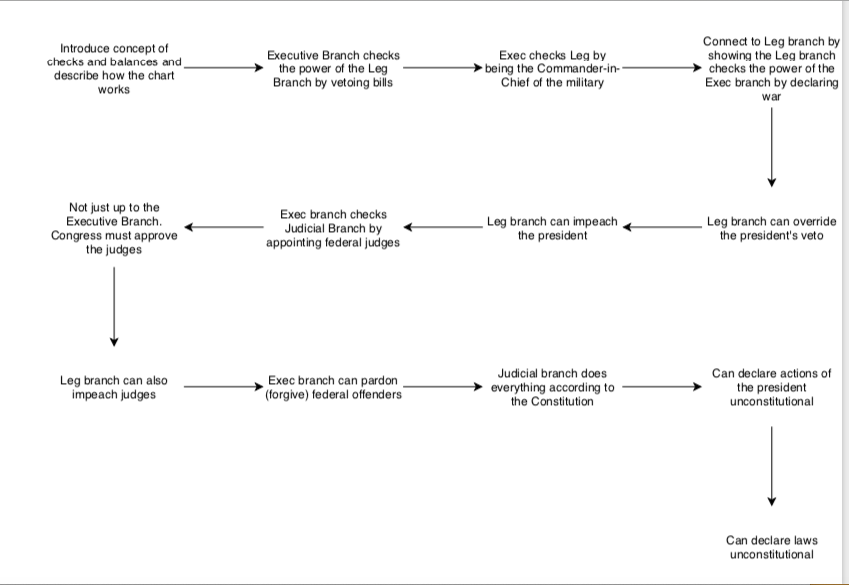
The conceptual map that was created in preparation for this video was a flowchart created using the web application mxgraph (shown below). It can be found at draw.io. The flowchart was a simple concept map showing the order in which the chart would be filled out and explained. It gave the creator of the video a diagram to follow in order to make sure that the video and its explanation would make sense. It also helped the creator to be sure that no part of the instructional process would be left out. It would be very easy for the video creator to lose track of which parts of the chart still needed to be explained or for the creator to mix up the order of the explanation. Because the topic of checks and balances requires one concept to build on another, missing a step could mean that a future step is unclear to the learner.
Concept Map (Created with web application draw.io)
The video was created using the Google Chrome application Screencastify. With this application, a user can record their screen and the audio that goes along with it. This is a great tool for teachers to use when going through a process that they would like their students to emulate. In this case it was how to fill out the checks and balances chart. It would also be a great tool for creating step by step directions for students to show them how to carry out a technical process on their own computer.
Once the application is added to the Chrome browser, the icon for Screencastify appears up in the top right section of the window next to the URL/search bar. Once the icon is clicked, the user can choose to give Screencastify permission to use the computer’s microphone. It also asks the user to choose whether or not they want just one window to be recorded or if they want their entire computer screen to be recorded. For the video mentioned above, only a window with a Google Doc open needed to be recorded.
The chart that the students would be using was opened in a Google Doc. Once the creator hits the record button, a countdown appears on the screen and the application begins to record what the user is doing on their screen and the audio picked up by the computer’s microphone. For this video, the creator filled in the chart in the Google Doc and spoke about the process, much as a teacher would do at the front of the room, minus any input from students that would have occurred in a typical in-class lesson. When the creator is ready to stop the recording, they can click the Screencastify icon at the top of the screen and hit the stop button.
The application then gives the user the choice of what they would like to do with their video. In this case, the creator chose to upload the video to YouTube. Screencastify makes the process extremely simple. The creator is able to log in to their YouTube account right there and choose the sharing settings for the video. Once the video is uploaded, anyone with the link to the video is able to view it. The video was embedded into the teacher’s website (www.hulicksocialstudies.weebly.com) under the Classroom Resources tab so that students can view it at home. There is also a link to YouTube above the video, set as the title above the embedded video, so students can access the video from YouTube as well.
The conceptual map that was created in preparation for this video was a flowchart created using the web application mxgraph (shown below). It can be found at draw.io. The flowchart was a simple concept map showing the order in which the chart would be filled out and explained. It gave the creator of the video a diagram to follow in order to make sure that the video and its explanation would make sense. It also helped the creator to be sure that no part of the instructional process would be left out. It would be very easy for the video creator to lose track of which parts of the chart still needed to be explained or for the creator to mix up the order of the explanation. Because the topic of checks and balances requires one concept to build on another, missing a step could mean that a future step is unclear to the learner.
Concept Map (Created with web application draw.io)